In your client area, you can monitor various server performance metrics through detailed graphs, which provide data on a daily, weekly, monthly, and annual basis. The available graphs cover the following resources:
Traffic
Network Packets Per Second (NetPPS)
CPU Usage
Load
Input/Output Operations (I/O)
Input/Output Operations Per Second (IOPS)
Memory Usage
Storage Usage
Each resource graph presents data in three key values:
Current: The most recent value recorded.
Average: The average value over the time period.
Maximum: The highest recorded value.
Traffic
This graph provides insights into the server's incoming and outgoing traffic, measured in kilobits, megabits, or gigabits per second (kbit/s, Mbit/s, Gbit/s).
Example of a daily graph:
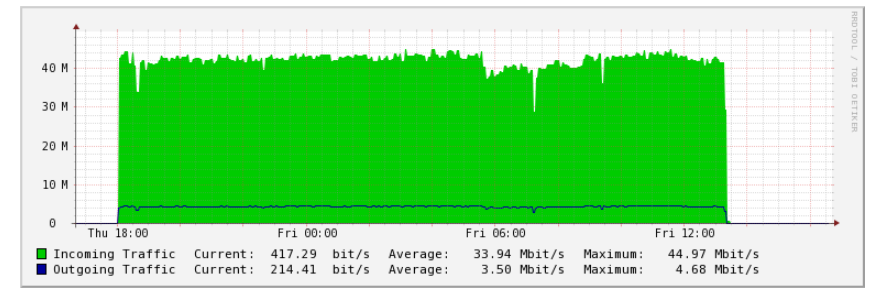
Maximum outgoing traffic: 4.68 Mbit/s
Maximum incoming traffic: 44.97 Mbit/s
Example of a Weekly Graph:
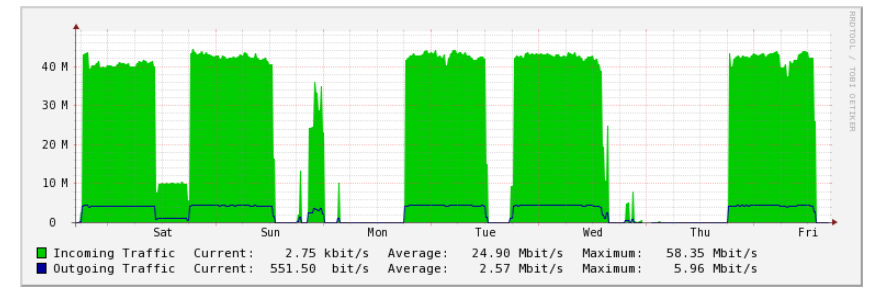
Maximum outgoing traffic: 5.96 Mbit/s
Maximum incoming traffic: 58.35 Mbit/s
NetPPS (Network Packets Per Second)
This graph shows the number of packets moving to and from the server, measured in packets per second (p/s).
Example of a Daily Graph:
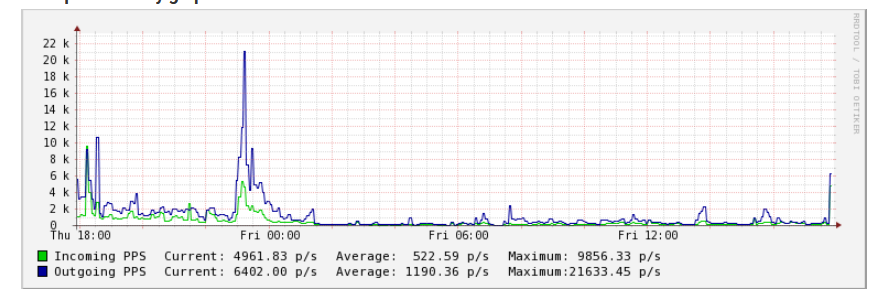
Maximum outgoing packets: 21,633.45 p/s
Maximum incoming packets: 9,856.33 p/s
Example of a weekly graph:
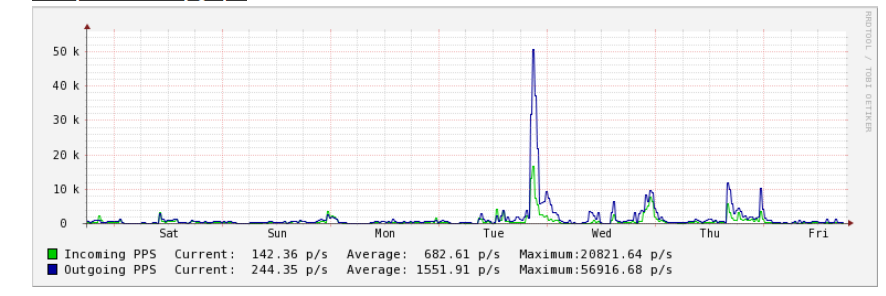
Maximum outgoing packets: 56,916.86 p/s
Maximum incoming packets: 20,821.54 p/s
CPU
This graph displays the server's CPU load, broken down into several categories:
User CPU: Time spent on system-initiated user processes (e.g., PHP, Apache, MySQL).
Nice CPU: Time spent on low-priority processes.
System CPU: Time spent on system-initiated processes.
Iowait CPU: Time spent waiting for I/O operations to complete.
Idle CPU: Time with no active processes.
Example of a Daily Graph:
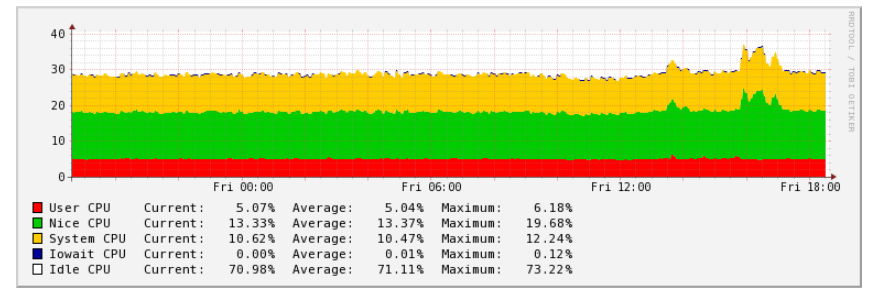
The server primarily runs low-priority processes, with a maximum CPU time of 19.68%. System processes use a maximum of 12.24%, and user processes use 6.18%.
Example of a Weekly Graph:
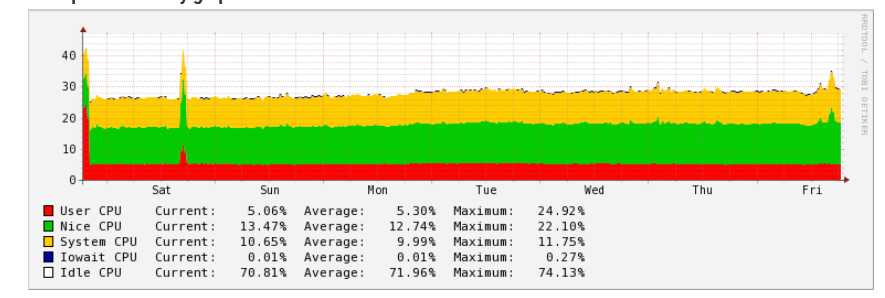
User processes dominate with 24.92%, followed by low-priority processes at 22.10%, and system processes at 11.75%.
Load
This graph indicates the server's load, presented as:
- Load Average (5 min): The average load over 5 minutes.
- Load Average (1 min): The average load over 1 minute.
Example of a Daily Graph:

Maximum 5-minute load average: 5.13
Given the server’s total capacity (28.8 GHz from 12 CPUs at 2.6 GHz each), the load is minimal.
User processes dominate with 24.92%, followed by low-priority processes at 22.10%, and system processes at 11.75%.
Example of a Weekly Graph:
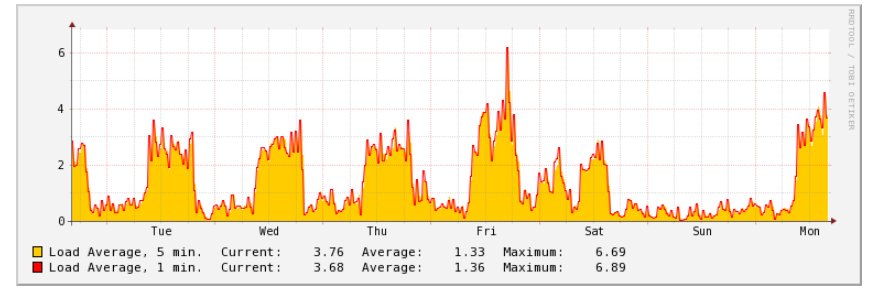
Maximum 5-minute load average: 5.71
You can find more information about the CPU load indicator here(You can find more information about the CPU load indicator here.).
I/O
The I/O graph shows disk read and write operations performed by the server, measured in bytes, kilobytes, or megabytes per second (B/s, kB/s, MB/s).
- Read I/O: Disk read operations.
- Write I/O: Disk write operations.
Example of a Daily Graph:
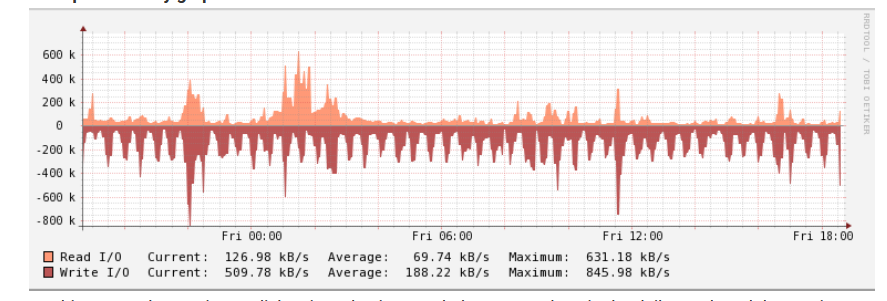
Maximum write speed: 845.98 kB/s
Maximum read speed: 631.18 kB/s
Example of a Weekly Graph:
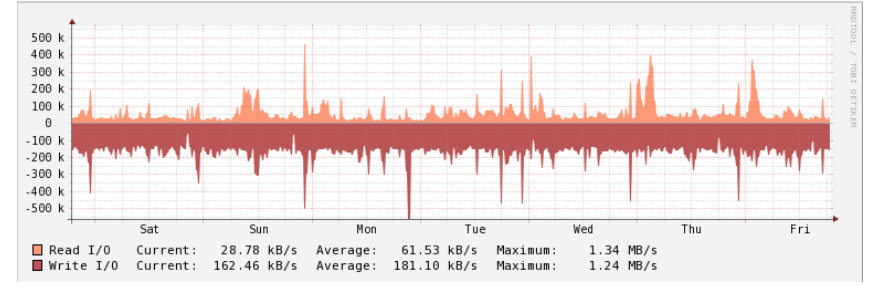
Maximum write speed: 1.34 MB/s
Maximum read speed: 1.24 MB/s
IOPS (Input/Output Operations Per Second)
This graph displays the number of disk read and write operations per second (io/s).
Read IOPS: Disk read operations per second.
Write IOPS: Disk write operations per second.
Example of a Daily Graph:
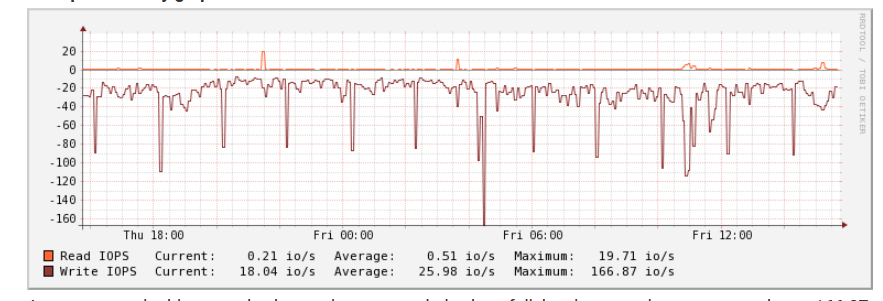
Maximum write operations: 166.87 io/s
Maximum read operations: 19.71 io/s
Example of a Weekly Graph:
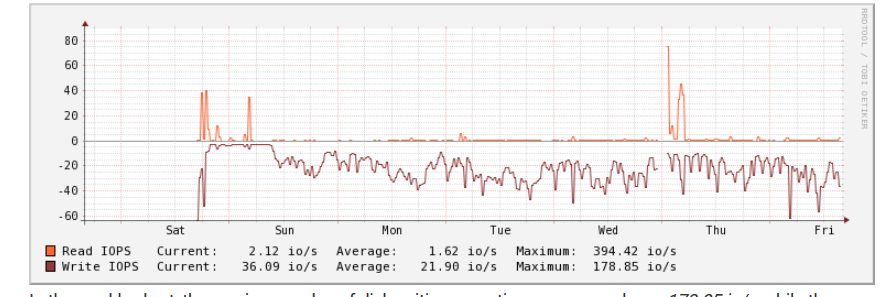
Maximum write operations: 178.85 io/s
Maximum read operations: 394.42 io/s
Memory
This graph shows the server's RAM usage, including:
Used Memory: Currently used memory.
Active Memory: Memory actively in use.
Active Swap: Swap memory in use.
Example of a Daily Graph:
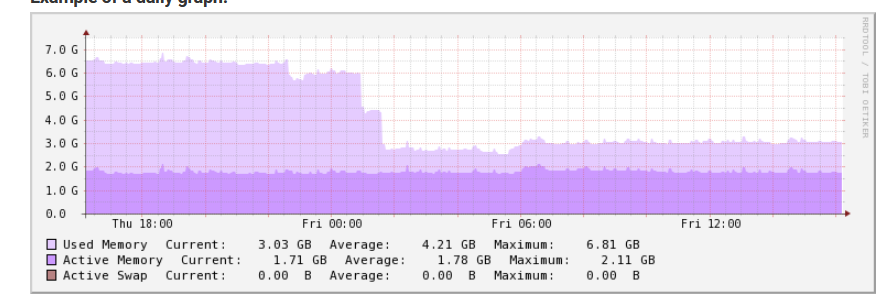
Current used memory: 3.03 GB
Current active memory: 1.71 GB
Active swap: 0.00 B
Example of a Weekly Graph:
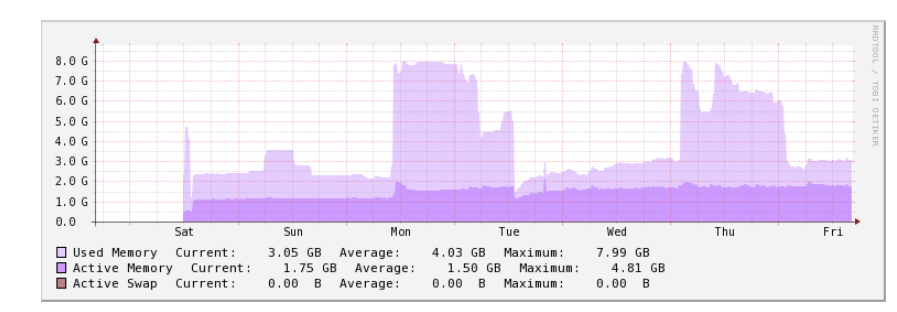
Maximum used memory: 7.99 GB
Maximum active memory: 4.81 GB
Storage
This graph displays the server's disk space usage.
Used Storage: Disk space currently in use.
Example of a Daily Graph:
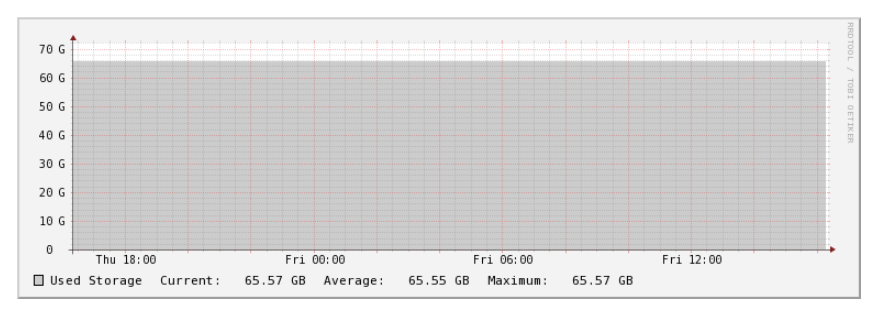
Current used storage: 65.57 GB
Example of a Weekly Graph:
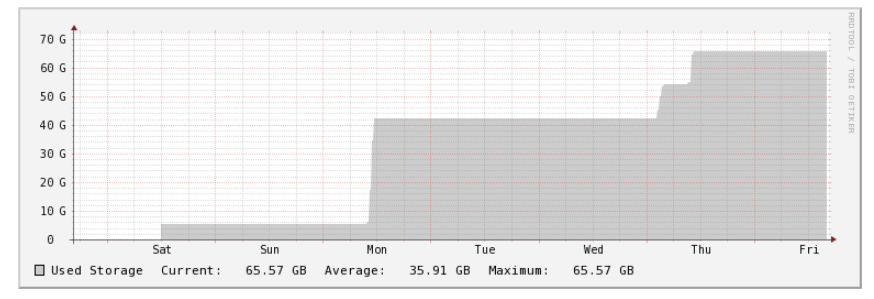
The graph shows a consistent increase in disk usage over the week.
For more detailed information on each of these metrics, you can explore additional resources linked throughout the client area.