Elasticsearch is a free, open-source search engine built on the Apache Lucene library. It can be installed across various platforms using Docker, deb, rpm, msi, tar.gz, and .zip archives. This guide will focus on installation using the RPM package manager. According to the official Elasticsearch documentation, RAM is the most critical resource for production servers. Ideally, Elasticsearch should run on a server with 64 GB of RAM, though 32 GB or 16 GB can also suffice. Even 8 GB is possible, but you might need multiple machines in such a case. In terms of CPU, Elasticsearch is not particularly demanding and can operate on 2-8 cores.
Requirements:
Linux VPS with at least 8 GB of RAM (16 GB or more recommended).
Java 8 installed.
Preparing for Installation:
If Java isn’t already installed on your server, you can do so with the following command:

Before installing Elasticsearch, download and install the public signing key:

Installation
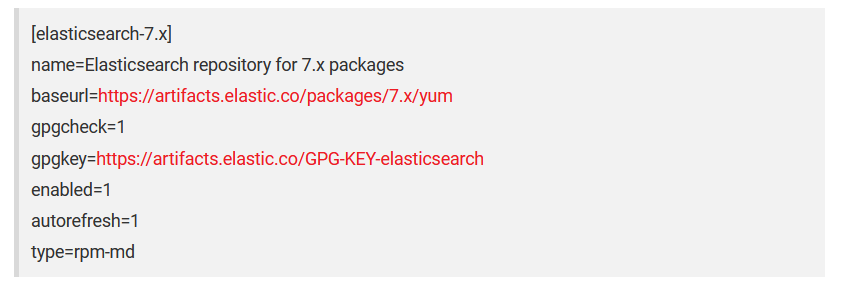
This guide assumes you are using the RPM package manager on a Linux 32-bit system with CentOS 7. Start by creating a file named "elasticsearch.repo" in the /etc/yum.repos.d/ directory:

Add the following contents to the file:
After saving the file, install Elasticsearch with:

Configuring Elasticsearch
By default, Elasticsearch loads its configuration from '/etc/elasticsearch/elasticsearch.yml'. This file allows you to set paths for storing data and logs, manage startup memory usage, configure custom ports, and adjust network settings. By default, Elasticsearch uses port 9200. For security reasons, it’s recommended to set network.host to localhost and http.port to 9200. Open the configuration file with:

Add or modify the following lines:

Be sure to save your changes.
Starting and Stopping Elasticsearch
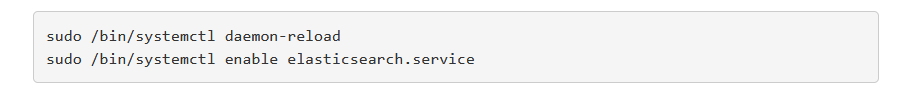
To ensure Elasticsearch starts automatically when your server boots, run:
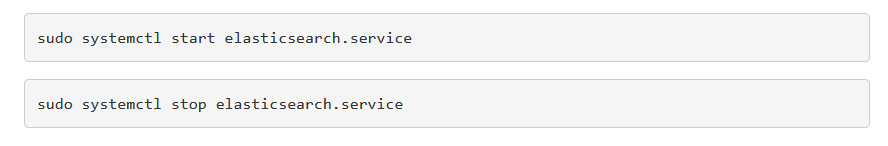
To start or stop the service manually, use:
Kibana
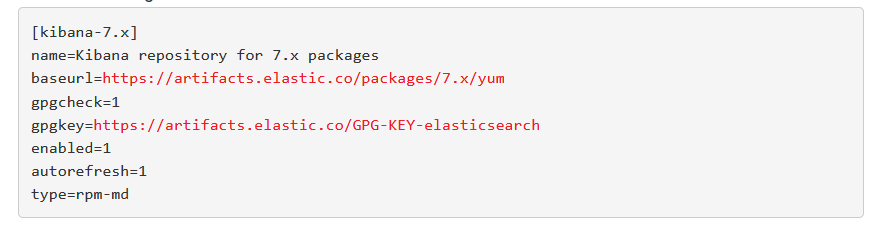
Kibana is an analytics and visualization platform for Elasticsearch. Its installation is similar to Elasticsearch. First, create a file named "kibana.repo" in /etc/yum.repos.d/:

Add the following content:
After saving the file, install Kibana with:

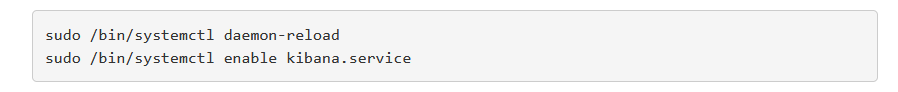
To start Kibana automatically at boot, run:
Configuring Kibana
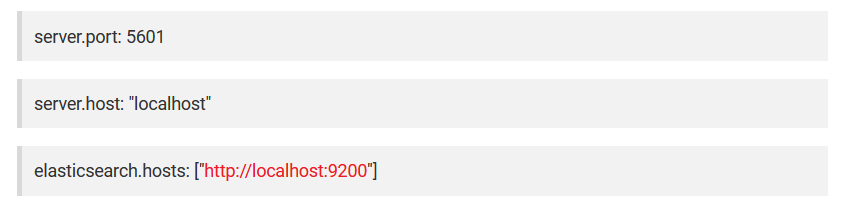
Kibana’s configuration file is located at /etc/kibana/kibana.yml. Open this file and uncomment the following lines to enable connections over localhost:
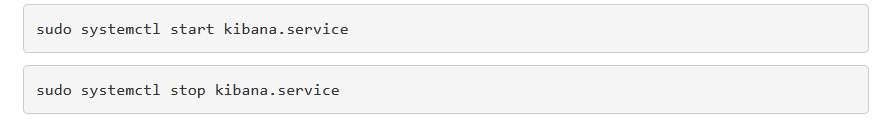
After configuring, start the Kibana service with:
Nginx Installation
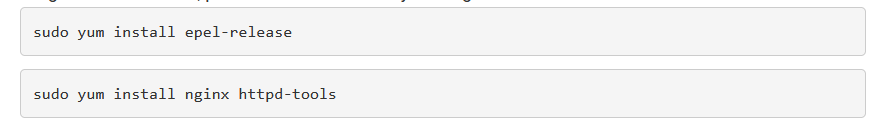
To allow proxy access to Kibana via Nginx, install Nginx with:
Create a new virtual host configuration file in the Nginx conf.d directory, adjusting "your-domain.com.conf" to your domain:

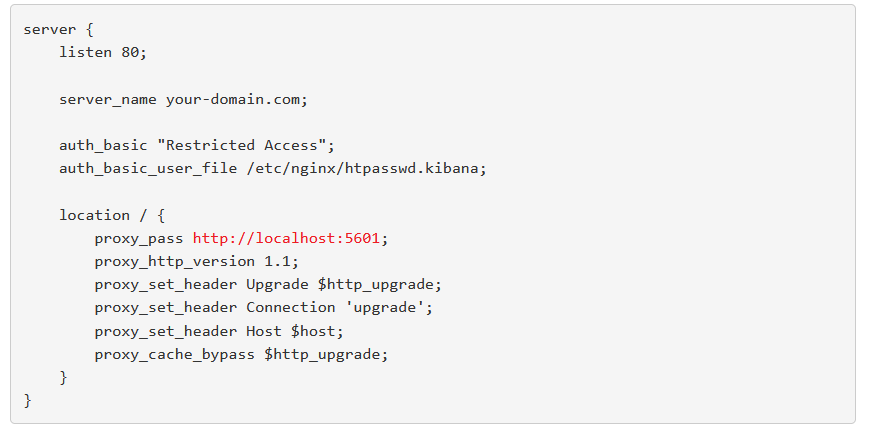
Add the following configuration, replacing "your-domain.com" with your actual domain:
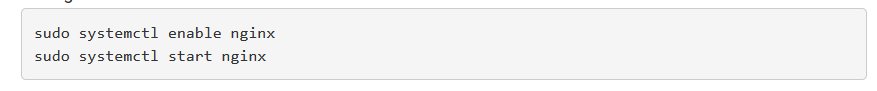
Enable and start Nginx with:
Restart Nginx to apply the configuration:

Create an admin user with a secure password, replacing "kibanat4vps" with your desired username:

Enter and confirm your password when prompted.
Logstash Installation
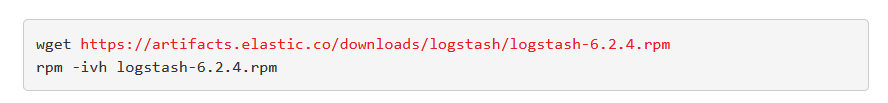
To process data before uploading it to Elasticsearch, use Logstash. Install it with:
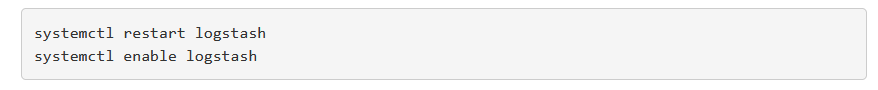
Start the Logstash service and enable it to start at boot:
Connecting to Kibana
If configured correctly, Kibana should be accessible via the domain set during Nginx configuration. After logging in with the username and password created earlier, you can begin using Kibana to upload and visualize data.
Kibana Dashboard Overview
The Kibana dashboard includes several key sections:
Search Field: Located at the top, with filtering options.
Time Selector: On the right of the search field, for setting time ranges.
Visualization Field: Displays data based on the selected search and time filters.
Application Column: Provides general management options.
Each visualization element can be adjusted and repositioned using the "Edit" option. Save changes with the "Save" button, or cancel them with "Cancel." The "Clone" option allows you to create backups of your dashboard.
Application Column Tools:
Discover: Explore data and access individual documents.
Visualize: Create visual data interpretations.
Dashboard: Display your collection of visualizations.
Canvas: Generate visuals with additional design elements.
Maps: Analyze data geographically.
Machine Learning: Automate data analysis for large-scale datasets.
Infrastructure: Monitor your infrastructure.
Logs: View detailed logs of servers, containers, and services.
APM (Application Performance Monitoring): Monitor application performance and errors.
Uptime: Monitor network availability (requires Heartbeat configuration).
Dev Tools: Access console, search profiler, and Grok debugger.
Stack Monitoring: Monitor Elastic Stack and Kibana performance.
Management: Adjust general Kibana settings.
For more detailed instructions on using Kibana, refer to the official Kibana documentation.