Introduction
In this tutorial, we’ll explore how to install and use three powerful command-line tools for network monitoring. These tools help identify which programs are using bandwidth in real-time.
We’ll be using the Ubuntu 16.04 distribution for this tutorial, but the instructions should work for all Debian and Ubuntu-based distributions available on Time4VPS.
Update System
Before we begin, it’s always a good idea to update your server. Run the following command to ensure your system is up-to-date:
apt-get update

Nethogs
Nethogs is an open-source, command-line tool that monitors real-time network traffic and shows which processes or applications are using bandwidth.
Installation
Once your system is updated, install Nethogs by running:
apt-get install nethogs
That’s it! Nethogs is now installed and ready for use.
Usage

To run Nethogs, simply enter:
nethogs

You will see the amount of traffic being used by each process in the "send" and "receive" columns, with the total bandwidth usage displayed at the bottom.
Useful Commands in Nethogs:
m: Change the display format between "kb/s", "kb", "b", and "mb".
r: Sort by traffic received.
s: Sort by traffic sent.
q: Quit.
Although simple, Nethogs is an excellent tool for associating network traffic with specific applications.
IPTraf

IPTraf is another powerful tool for monitoring network traffic, offering various interactive interfaces for deeper insights.
Installation
To install IPTraf on Ubuntu, use the following command:
apt-get install iptraf
Usage
To start IPTraf, run:
iptraf

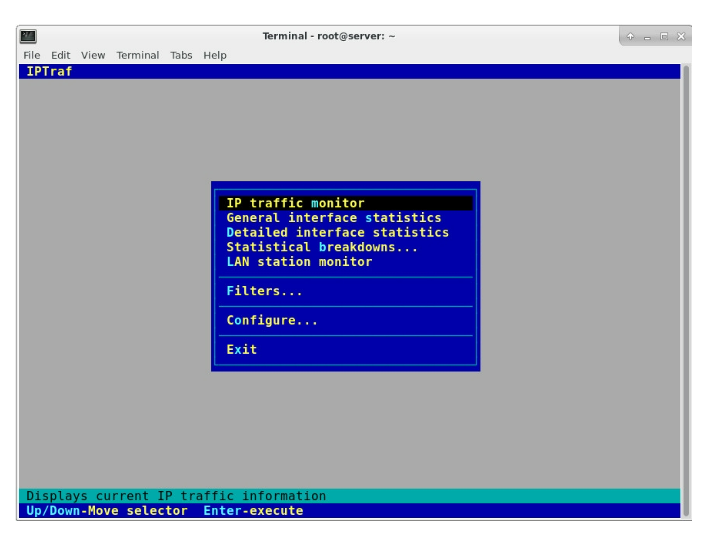
This will open an interactive menu where you can choose which network interface to monitor. For a general overview of all network traffic, select the first option and then "All interfaces". This will show you the IP addresses involved in the traffic across all your network interfaces.
If you want to resolve these IP addresses to domain names, exit the traffic screen, go to "Configure", and enable "Reverse DNS lookups". You can also enable "TCP/UDP service names" to display service names instead of port numbers.
IPTraf provides several other interfaces to explore for more detailed network analysis.
Netstat

Netstat is a command-line network utility that displays various network statistics, including active network connections (both incoming and outgoing), routing tables, and other network interface statistics. It’s a powerful and flexible tool.
Usage
By default, running netstat shows a list of open sockets:
netstat
A particularly useful command is:
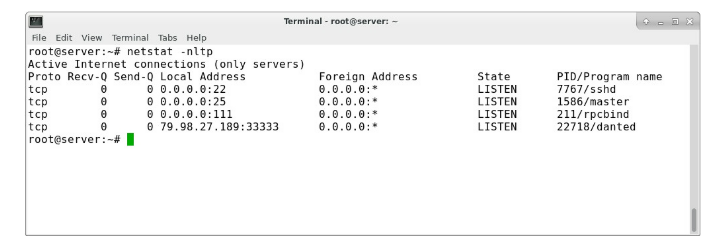
netstat -nltp

This shows listening ports along with the associated process IDs.
For more options, check the help and manual pages:
netstat --help
man netstat
These three tools—Nethogs, IPTraf, and Netstat—are invaluable for monitoring and analyzing network traffic on your server.