Introduction
Monitoring memory usage and the memory consumed by individual processes on servers is crucial to ensuring sufficient resources for users. For example, in the case of a website, the server must have enough memory to handle incoming traffic. Insufficient memory can lead to a slow website or, in extreme cases, cause the site to go offline during traffic spikes.
Linux-based operating systems offer powerful tools like the vmstat and free commands to monitor memory allocation. These tools are essential for server administrators, though they can be somewhat confusing at first. This article will explain the output of these commands and some common use cases.
This tutorial uses Ubuntu 16.04, but it should be applicable to all Debian and Ubuntu distributions available through Buy Cheap VPS.
Update System
Before proceeding, it’s always a good practice to ensure your server is up to date. You can do this by running the following command:
apt-get update

Checking Memory Usage with the free Command
The free command is the simplest and easiest way to check memory usage on Linux. When run without any options, the output appears like this:
free
Here are some key points about the output:
- All values are shown in Kilobytes (KB) by default (1 KB = 1024 bytes), though this can be customized.
- The "shared" column is obsolete, as noted in the free man page.
- The output displays memory usage for both RAM and swap space, showing how much physical RAM is allocated for buffering and caching by applications.
To customize the output, the free command offers several options:
-b – Displays output in bytes
-k – Displays output in kilobytes
-m – Displays output in megabytes
-g – Displays output in gigabytes
--tera – Displays output in terabytes
-h – Displays output in a human-readable format (e.g., 1.5M)
-t – Adds a total row to the output
For a more readable format, we can use the -m option to display the output in megabytes:

The output will show all values in MB. For example, a total of 16384 MB indicates the system has 16 GB of RAM. The "used" column shows 124 MB of RAM is in use, while the rest of the memory is either cached or available. Linux often uses unused RAM for caching to improve performance, but this memory is freed up when necessary.
The last line shows swap memory, which, in this case, is entirely unused.

Checking Memory Usage with the vmstat Command
vmstat (virtual memory statistics) is a system monitoring tool that collects and displays information about memory, processes, interrupts, paging, and block I/O. By specifying a sampling interval, users can observe system activity in near real-time.
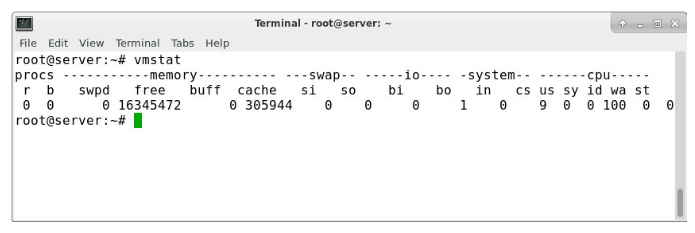
To get an overview of memory usage, run:
vmstat
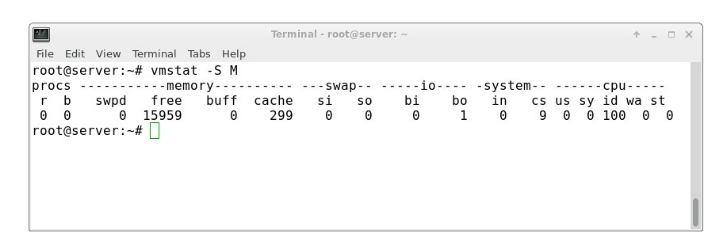
To see the results in megabytes, use the -S flag:

vmstat -S M

This output helps break down the "-/+ buffers/cache" category from the free command, showing how much memory is used for buffering and how much is used for caching.
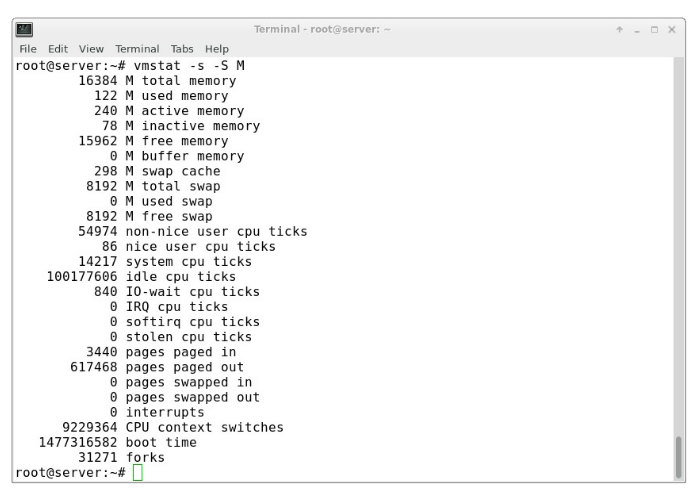
For more detailed statistics, you can use the following command:
vmstat -s -S M
This will display general statistics about memory usage in megabytes.
