Netdata is a powerful performance monitoring tool that provides real-time insights through web panels, visualizing various aspects of your Linux system. It tracks metrics like CPU usage, memory, disk activity, network performance, and more.
The beauty of Netdata is its zero-configuration setup post-installation. It matches the performance of built-in tools like vmstat, iostat, and htop, but with greater ease of use. Netdata automatically collects over 5,000 metrics with no setup required, has no dependencies, and includes over 100 pre-configured alarms to alert you to common issues related to failures, performance, and availability.
Requirements:
Debian, Ubuntu, CentOS, or Fedora operating system.
For Debian/Ubuntu systems, start by installing curl:
apt-get install curl
For Debian/Ubuntu and CentOS/Fedora, you can use a simple one-line installation script to install the latest version of Netdata and ensure it stays updated automatically.
bash <(curl -Ss https://my-netdata.io/kickstart.sh)
The script performs the following actions:
Detects your distribution and installs the necessary packages to build Netdata (you'll be prompted for confirmation).
Downloads the latest Netdata source code to /usr/src/netdata.git.
Installs Netdata by running ./netdata-installer.sh from the source directory.
Sets up netdata-updater.sh in cron.daily to ensure daily updates for Netdata (you’ll only receive a notification if the update fails).
Once the installation is complete, open your browser and visit http://your_server_ip:19999/ to access the dashboard.
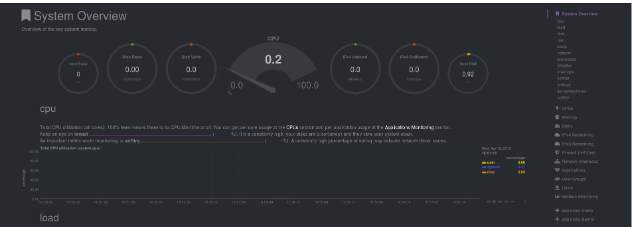
You'll find a dashboard providing an overview of your system’s performance. Interactive HUD-style indicators at the top of the page update as you hover over different time periods in the charts. You can also drag the diagrams with your mouse for a closer look.

To adjust the time interval displayed in the chart, hold down the Shift key and scroll your mouse wheel. To reset the chart to its default view, simply double-click on it.
The graphs and diagrams in this section provide detailed reports on various system metrics, including CPU usage, memory, network traffic, and more.
A key feature of the GUI is the update page. Netdata receives regular updates, making it easy to keep the installation current. The Update button at the top of the toolbar lets you check for new versions.
Clicking this button will provide more information and access to the update menu. Use the Check Now button to manually check for updates.